
Sketch-Style Chart Generator
Use Sketch-Style Chart Generator
All GotoKit tools run directly online, no download required.
Create sketch-style charts online with 2-12 editable data rows and instant preview.
Chart Data (2-12 rows)
About this tool
Charts that feel scribbled on a whiteboard — but with honest numbers behind the shaky strokes. Paste labels and values straight into the grid, and roughViz renders bars, horizontal bars, pies and donuts with jittered hand-drawn lines you can restyle or export as editable SVGs for talks, docs and mockups.
- Converts as you type with live preview
- Handles batch input and very long text
- Unlimited usage
- Processed locally, nothing sent out
Compared with common text editing workflows
| Aspect | This tool | Typical alternative |
|---|---|---|
| Speed | Paste and process instantly | Often needs another app or script |
| Best for | Cleanup, sorting, pre-rewrite prep | Long-form collaboration and revision history |
| Privacy | Leans toward instant local processing | Depends on editor and sync stack |
Docs
Create hand-drawn bar, pie, donut, and horizontal bar charts from 2 to 12 rows of data, then export crisp SVGs for slides, docs, or websites.
Compared with traditional chart tools, this page is better for communicating ideas, trends, and structure instead of strict numeric precision. It is especially useful for brainstorming, teaching, proposal drafts, and early-stage presentations.
Core Features
- Online data entry with 2 to 12 editable rows
- Multiple chart types: Bar, Horizontal Bar, Pie, and Donut
- Visual style controls: roughness, stroke width, main color, and stroke color
- Instant rendering after clicking the generate button
- SVG export for high-quality reuse and editing
How To Use
- Select a chart type and optionally enter a chart title.
- Fill in label and value for each data row (minimum 2, maximum 12).
- Tune visual parameters such as roughness and colors.
- Click
Render Chartto generate a preview. - Click
Export SVGif you want to save the output for documents or slides.
Typical Scenarios
- Fast trend communication in meetings
- Lightweight visuals for product docs and tutorials
- Draft chart assets for classes and workshops
- Storytelling slides where style and direction matter more than precision
Notes
- Non-numeric values or empty labels are ignored automatically.
- This is a frontend visualization helper, not a full BI reporting platform.
- Export SVG files for long-term storage and version tracking.
Last verified: 2026-04-27
Source: jwilber/roughViz
How to read this chart
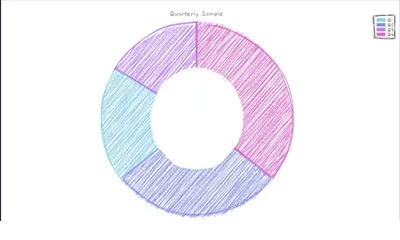
The strokes are deliberately wobbly, but bar heights and pie angles still follow the real proportions — do not discount the numbers because of the sketch style. Read pies and donuts by angle, bars by height. For informal demos keep the jitter; for stricter reports, reduce the roughness so the proportions read more cleanly.
FAQ
What chart types?
4 types: bar, horizontal bar, pie, donut. Enter 2-12 rows.
Can charts be exported?
Yes. One-click SVG export for docs, web, presentations.
Is this tool suitable for long text or batch text processing?
Yes. Text tools here are designed for quick cleanup, conversion, sorting, and formatting. For anything from a few lines to large pasted blocks, start with a test run and then split into batches if needed.
Will my text content be uploaded to a server?
Standard text tools default to browser-side processing, which is better for drafts, private text, and temporary data. If any feature depends on an AI model, the page copy will say so clearly.
Is this tool useful for students, writers, or developers?
Yes. Students often use it for note cleanup, writers use it for draft cleanup and rewriting prep, and developers use it for formatting, encoding, and structured text workflows.
Can I use this tool on mobile phones or tablets?
Most tools work in modern mobile browsers, but complex charts, larger files, and precision drag-and-drop tasks usually feel better on desktop. If speed and control matter, desktop is the safer choice.
Is this tool better for one-off tasks or recurring workflows?
It is strongest for fast one-off tasks, quick verification, and temporary exports. If you need long-term automation, team collaboration, or deeper integration, you will usually pair it with desktop software, scripts, or a larger system.
How can I get a better result on the first try?
Start with the built-in example or with the smallest realistic sample you have. Once the format, layout, and export look right, switch to the full dataset or final asset. This is usually the fastest way to catch formatting issues early.
More from Text Tools
All Text Tools toolsMarkdown Editor
Write Markdown with live preview, GitHub-flavored formatting, and one-click export to Markdown or HTML.
Text Case Converter
Convert text to sentence case, title case, UPPERCASE, lowercase, camelCase, and more, then copy or export the result.
List Sorter
Sort text and numbers online with alphabetic, numeric, natural, and length modes. Dedup, delimiter, column sort, export to CSV/TXT/JSON.
AI Title Generator — Blog, YouTube & Social Media
Generate catchy, SEO-friendly titles for blogs, YouTube videos, and social media with AI. Pick a platform and tone, get optimized titles with quality scores instantly.